Waste
2030 Waste Goals and Our Progress to Date
In 2021, we established new waste goals to reduce landfill waste, address plastic waste from our operations and support integration of sustainability into the designs of our products.
Zero waste to landfill from routine operations
In 2023, 16 out of Lilly’s 29 facilities achieved the zero-landfill target, resulting in 2% of our waste from routine operations being sent to landfill. While the number of our facilities reaching the zero-landfill target increased, there was a small overall increase from 2022 in the aggregate percentage of routine operations waste being sent to landfill, which was driven by an operational matter with one of our internal waste management processes and on-boarding a new manufacturing site. We do not anticipate that these drivers will impede our long-term goal.
100% of plastic waste repurposed for beneficial use, with at least 90% recycled or reused
In 2023, we were able to repurpose 97.1% of plastic waste for beneficial use (reuse/recycle/waste-to-energy), primarily driven by recycling of plastics from our manufacturing processes and incoming packaging material. Of this plastic waste, 88.4% was recycled or reused, bringing us close to our 90% goal.
Managing Waste Across Our Operations
In 2023, Lilly generated 118,000 metric tonnes of waste, representing a 9% reduction in total waste versus 2020. This reduction was achieved while increasing manufacturing production rates across the same period. Most of the waste (84%) generated by Lilly is considered non-hazardous by relevant regulatory authorities. The remaining 16% of waste we generate that is considered hazardous is carefully stored and packaged, and shipped to approved treatment facilities, some of which recover energy from the waste. We strive to only send hazardous waste to landfills when there is no other option or when required by law.
Plastic Waste Reduction Efforts
We are focused on minimizing our plastic waste footprint. To do this, we reduce the generation of plastic waste where possible, identify where recycled plastic materials are suitable for use in our processes and maximize the reuse and recycling of plastic waste. When reduction, reuse and recycling are not viable, we send plastic waste to a facility that converts waste into energy.
In 2021, Lilly began developing processes for measuring and reporting plastic waste. We use both quantitative and qualitative measurement systems. These systems allow us to estimate our current progress relative to our plastic waste goals, and we strive to improve these measurement systems over time.
As noted, we were able to repurpose 97.1% of our plastic waste for beneficial use (reuse/recycle/waste-to-energy) in 2023, primarily driven by recycling of plastics from our manufacturing processes and incoming packaging material. Of our total plastic waste, approximately 88.4% was recycled or reused. While these numbers are close to our established plastic waste goals, we anticipate that it will take significant efforts – such as new technologies and innovative external capacity – to achieve 100% beneficial use and at least 90% reused or recycled.
Integrating Sustainability into Our Product and Packaging Design Processes
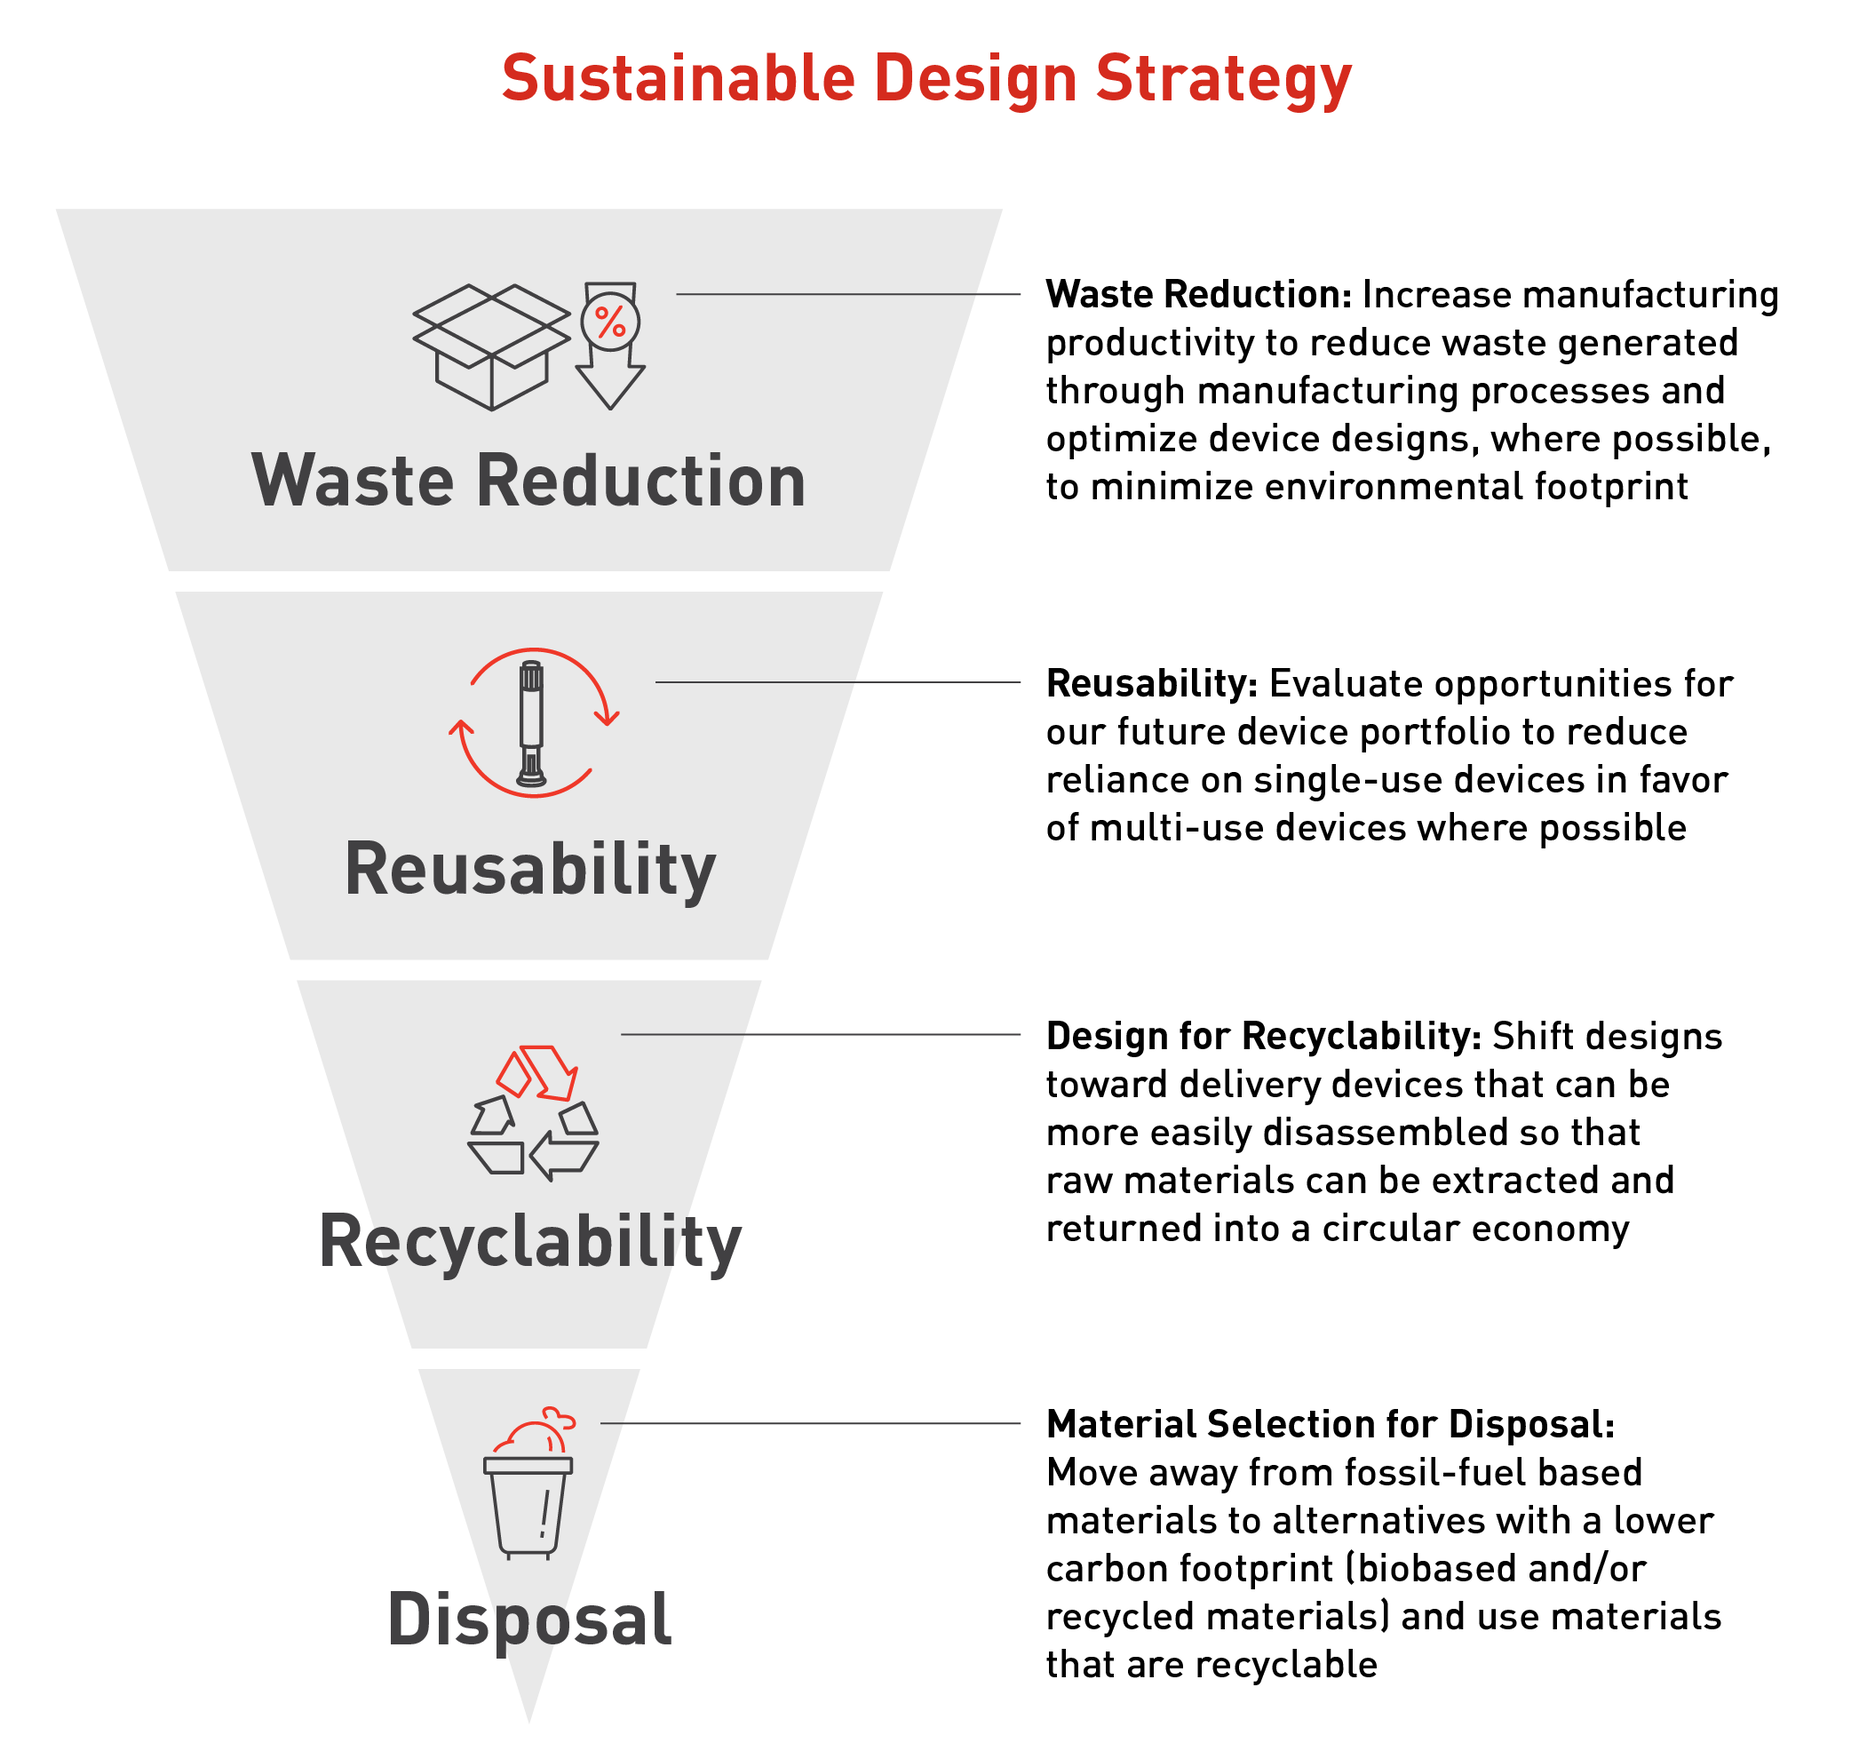
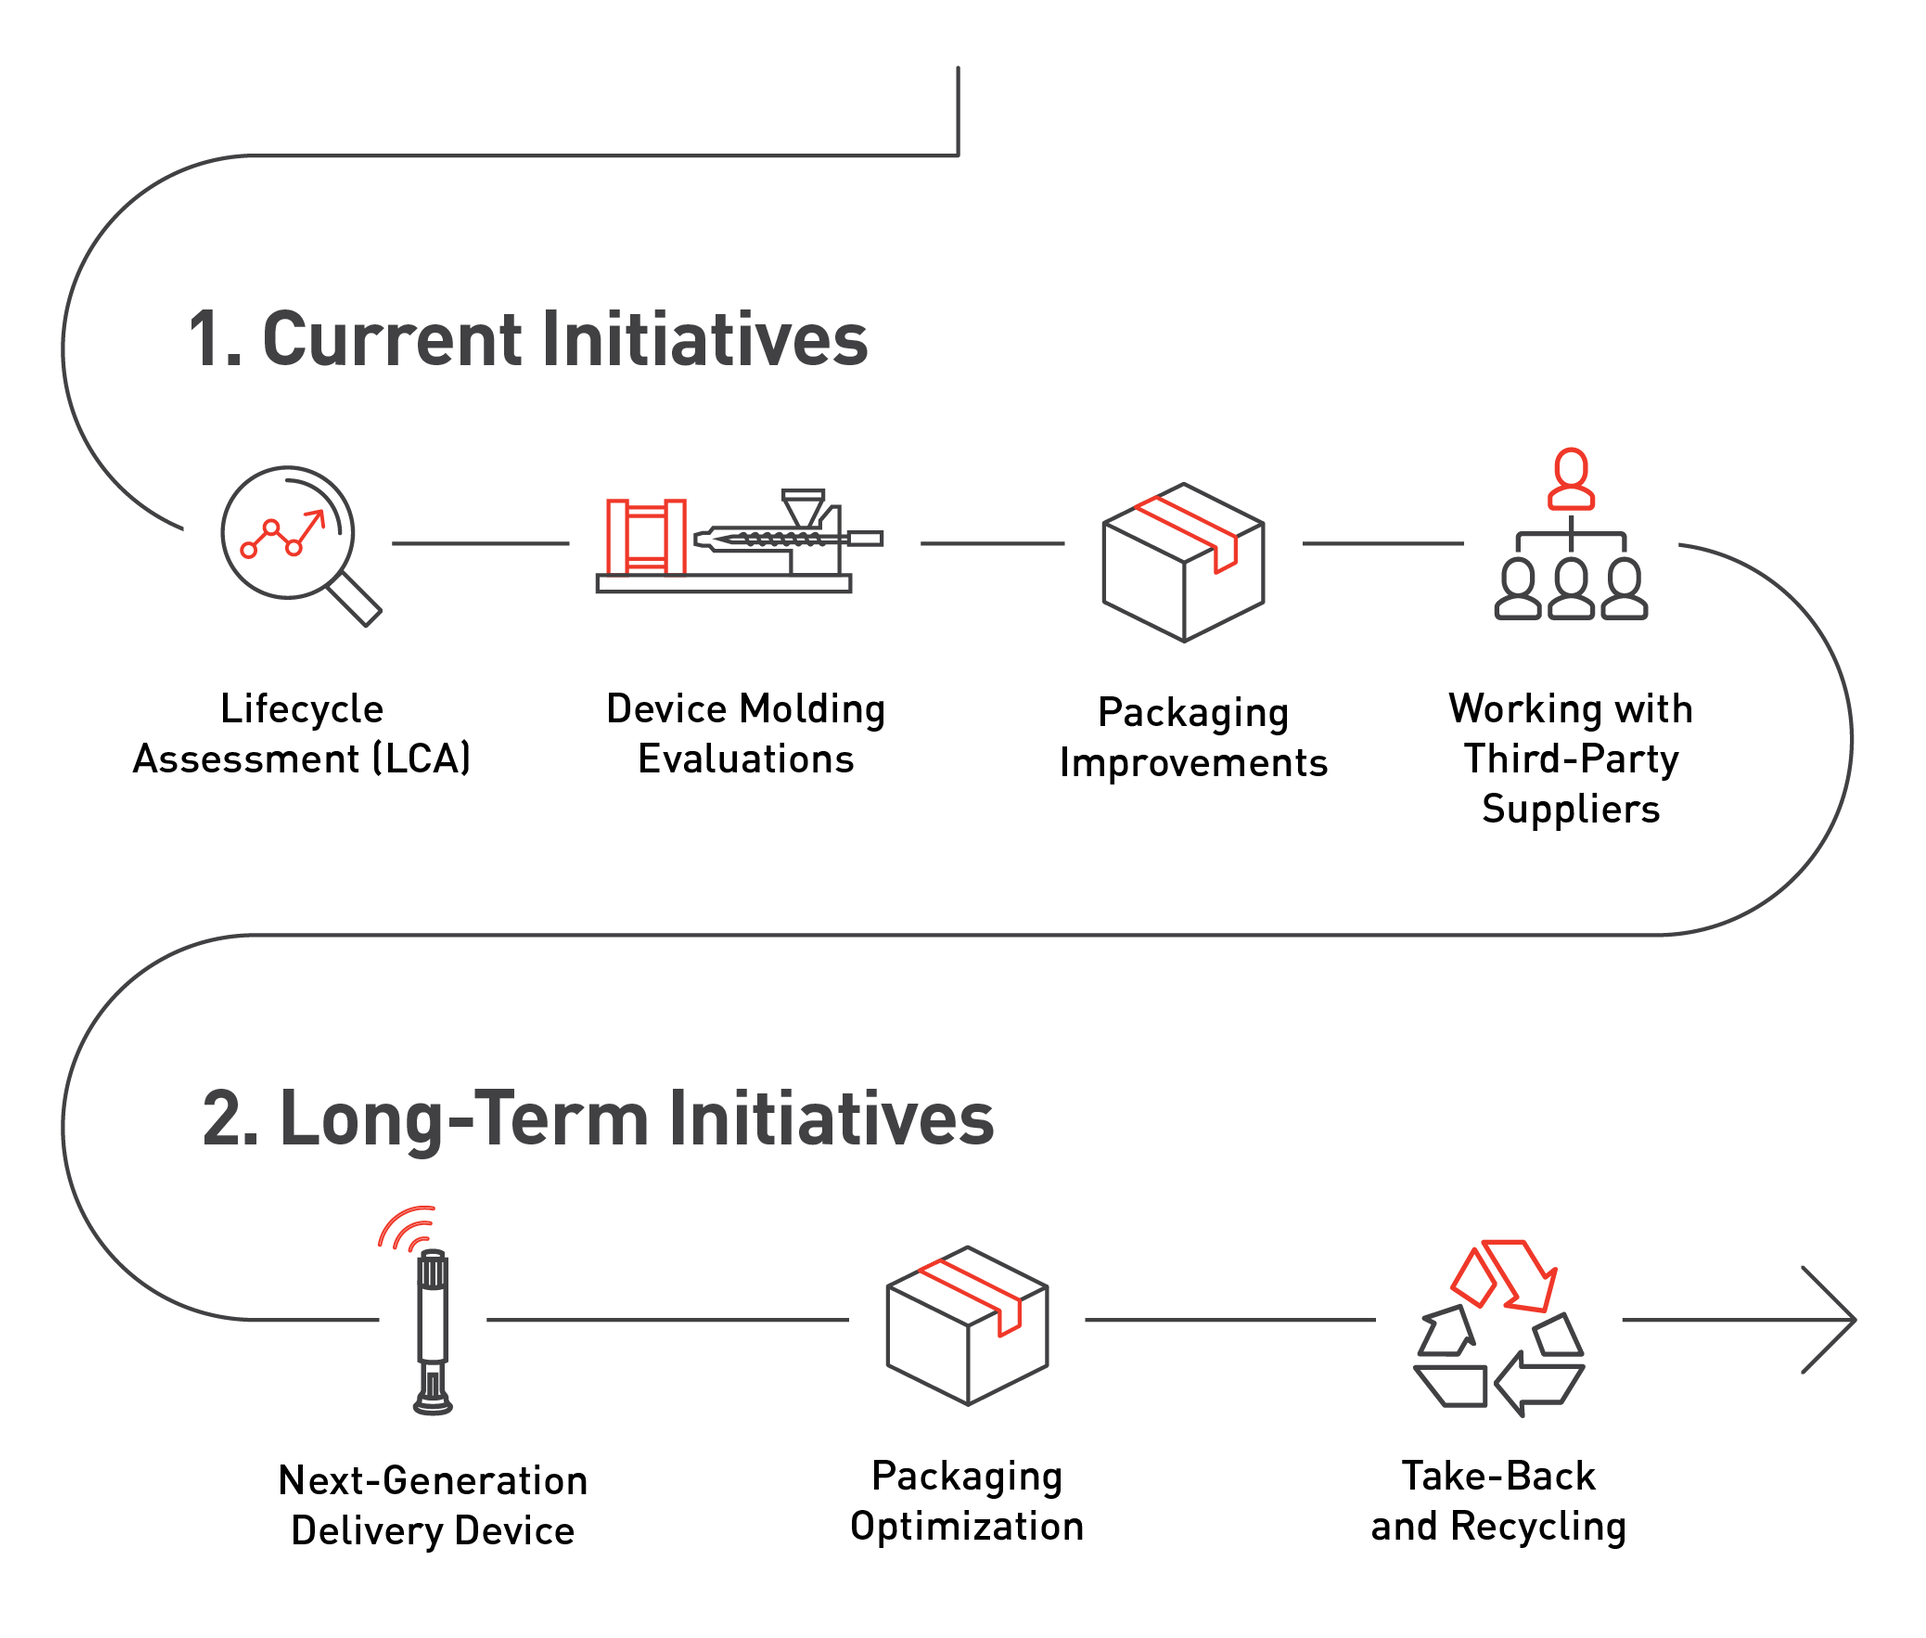
To support our 2030 waste goals, we continue to build on efforts to incorporate sustainability into the lifecycle of our products, delivery devices and packaging, with waste reduction in mind. Our goal is to integrate sustainability-focused design principles into future product and packaging design processes, while identifying and evaluating opportunities to enhance our current portfolio including labeling in some markets that will better inform the patient on disposal. We aspire to develop products that are inclusive, trustworthy and sustainable.
Inclusive
We strive to design intuitive experiences that are inclusive of the unique capabilities and changing conditions of people around the world and that meet their diverse abilities and needs.
Trustworthy
We demonstrate care and compassion for people and aim to create devices and packaging that are consistent, reliable and easy to learn and use across all touchpoints.
Sustainable
We strive to design our therapies, devices, packaging and experiences for longevity and minimal environmental impact.
We aim to make our products more sustainable without sacrificing safety, user experience or patient outcomes. We strive to position our products at the top of our “reduce, reuse, recycle” waste hierarchy, and design for recyclability while also reducing medical waste and electronic waste. We are investing to research and identify renewable/bio-based materials to make our future packaging and devices more sustainable and we are exploring collaborations and partnerships with our key materials suppliers to evaluate the feasibility for improving the sustainability of existing devices.
Lilly has developed a Design for Sustainability Guidebook to support the design of our next generation of delivery devices to meet Lilly’s environmental goals. The guidebook is used internally to provide insights into sustainability approaches in device and secondary packaging design, materials, and recycling. It aims to increase knowledge in this space and explore best practices when designing our devices and packaging in a regulated environment.
Visit our Product Stewardship page to learn more about our approach to sustainability throughout product life cycles.
Waste Performance Data
Total Waste Generation (1)
|
2020
|
2021
|
2022
|
2023
|
|---|---|---|---|---|
|
Total Waste Generation (metric tonnes)
|
2020:
130,000
|
2021:
118,000
|
2022:
123,000
|
2023:
118,000
|
|
Non-Hazardous Waste (metric tonnes)
|
2020:
110,000
|
2021:
98,000
|
2022:
101,000
|
2023:
99,000
|
|
Hazardous Waste Generation (metric tonnes)
|
2020:
20,000
|
2021:
20,000
|
2022:
22,000
|
2023:
19,000
|
Total Waste Disposition (1)
|
2020
|
2021
|
2022
|
2023
|
|---|---|---|---|---|
|
Beneficial Use (includes recycled, reused and waste-to-energy)
|
2020:
120,000
|
2021:
108,000
|
2022:
111,000
|
2023:
105,000
|
|
Treated (includes combustion without energy recovery) (metric tonnes)
|
2020:
7,300
|
2021:
7,100
|
2022:
8,000
|
2023:
9,200
|
|
Landfilled (metric tonnes)
|
2020:
2,700
|
2021:
2,300
|
2022:
4,000
|
2023:
3,500
|
Waste Metrics for Goals (1)
|
2020
|
2021
|
2022
|
2023
|
|---|---|---|---|---|
|
Waste Generated from Routine Operations (metric tonnes)
|
2020:
Not previously reported
|
2021:
107,000
|
2022:
110,600
|
2023:
102,000
|
|
Waste to Landfill from Routine Operations (metric tonnes)
|
2020:
Not previously reported
|
2021:
600
|
2022:
1,900
|
2023:
2,000
|
|
Plastic Waste from Routine Operations (metric tonnes)
|
2020:
Not previously reported
|
2021:
8,600
|
2022:
12,000
|
2023:
12,400
|
|
Plastic Waste Repurposed for Beneficial Use (includes recycled, reused and waste-to-energy) (metric tonnes)
|
2020:
Not previously reported
|
2021:
8,400
|
2022:
11,800
|
2023:
12,100
|
|
Plastic Waste Recycled or Reused (metric tonnes)
|
2020:
Not previously reported
|
2021:
7,600
|
2022:
10,800
|
2023:
11,000
|
Waste Goal Performance (2)
|
2030 Goal
|
2022 Performance
|
2023 Performance
|
|---|---|---|---|
|
Percent of Waste from Routine Operations Sent to Landfill3
|
2030 Goal:
Zero (less than 0.5%)
|
2022 Performance:
1.7%
|
2023 Performance:
2.0%
|
|
Percent of Routine Plastic Waste Repurposed for Beneficial Use
|
2030 Goal:
100%
|
2022 Performance:
98.0%
|
2023 Performance:
97.1%
|
|
Percent of Routine Plastic Waste Recycled or Reused
|
2030 Goal:
Greater than or equal to 90%
|
2022 Performance:
89.6%
|
2023 Performance:
88.4%
|
|
Integrate Sustainability-Focused Design Principles into Our Products and Packaging
|
2030 Goal:
N/A
|
2022 Performance:
On Track
|
2023 Performance:
On Track
|
Footnotes
Note: Some segments do not add up to totals due to rounding.
Note: Bureau Veritas was engaged by Eli Lilly and Company to provide limited assurance in relation to specified 2023 environmental performance data presented.
Total waste includes all waste generated from Lilly facilities, routine waste and non-routine waste. Non-routine waste is defined in footnote 2.
Waste goals exclude waste from the following categories: non-routine construction and demolition debris (e.g., building construction or demolition); uncontaminated soil, rock, concrete, bricks, etc., used for clean fill; waste generated as a result of remediation of surface or underground areas (e.g., soil, rock, water and personal protective equipment); vegetation (e.g., landscaping debris), wastewater that is conveyed offsite through piping (i.e., not shipped offsite in container or tanker) for treatment or discharge; and biosolids or other residue from wastewater or stormwater collection and treatment.
For the purpose of our landfill goal, “zero landfill” is defined as elimination, reuse, incineration, reclamation or recycling to the point that routine waste as generated will no longer be placed in a landfill. A site may achieve “zero landfill” status if less than 0.5% of its generated routine waste is sent directly to landfill. Lilly will meet “zero landfill” status if less than 0.5% of Lilly’s routine waste as generated is sent directly to landfill.
Explore our Environmental Goals and Progress
See important information about our Sustainability report.


